The data can be plotted with
axis([350 700]);
plot(data);
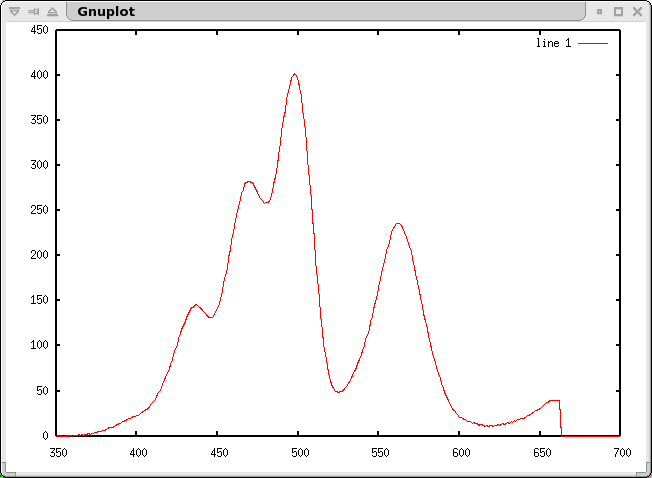
this image shows a glow curve acquired from a TLD-700 tablet.
Deconvolution
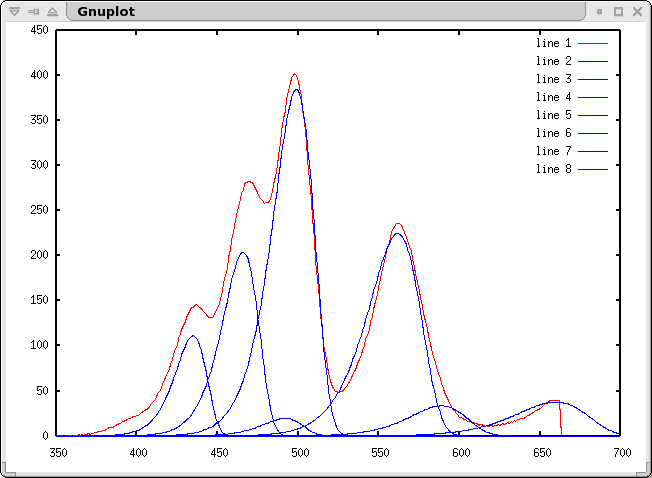
The initial deconvolution is done with the script [gc_deconv.m] which also needs the kernel function [gc_kernel.m] based on first order kinematics, see reference [1]. The script applies a version of the "CLEAN" algorithm, known from astronomy.
yy = gc_deconv(data);
This files prints initial guesses for the characteristic temperature and the integral of the peaks found.
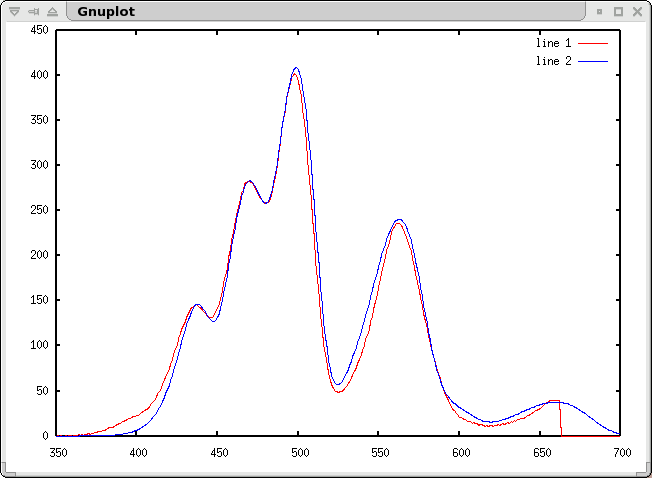
With plot((1:701),data,(1:701),yy,'b'); one can see how well the deconvolution worked out.
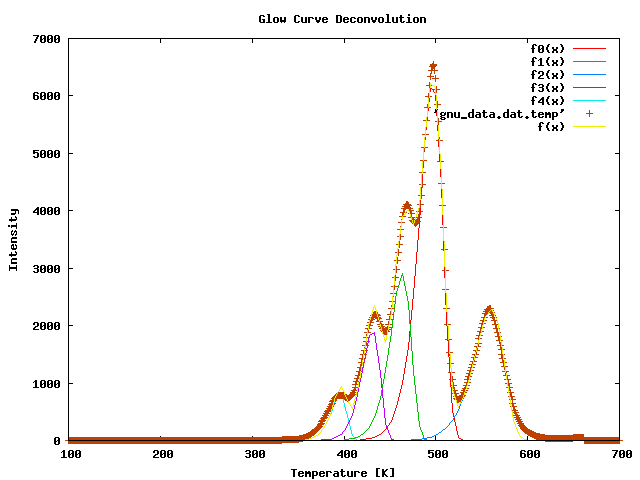
In the latest version of the deconvolution package, these results are being used as an intitial guess for the fit which will be performed afterwards. The fit is done with gnuplot.
After the fitting parameters are found, the fit is repeated with all parameters fixed except for those related to the intensity of the individual peaks. Thereby the statistical error of the intensity is known, and for a normalized peak, this error is equal to the relative error of the peak area.
Additional Deconvolution Scripts
Since I had hundreds of glow curves I had to deconvolute, I automated the process with a bunch of additional scripts:[deconv_script.sh] is the top level script which resides in the /GNUPLOT directory in the tarball below.
I tried to keep human interaction to a minimum, but you still have to specify with how many peaks you wish to extract from the glow curve. The code will most likely fail to produce reasonable results if the glow curve show less peaks than you wish to extract. Therefore the package contains a collection of scripts if you wish to extract less peaks than 7. These can be found in the directories /GNUPLOT_6 .. /GNUPLOT_1
Before executing the files you must adjust the path in the shell script to point to the places where the respective files are located, since the scripts are relying on absolute paths. (Sorry for the mess.) Then execute the main script devonv_script.sh "*.dat" in order to deconvolve all files ending with ".dat".
The final results are stored in the same directory with the ending *.gfit2 among with a *.png image of the fit.
Final set of parameters            Asymptotic Standard Error
=======================            ==========================

I0              = 6558.41          +/- 18.98        (0.2894%)
I1              = 3027.25          +/- 20.49        (0.6768%)
I2              = 2400.52          +/- 16.57        (0.6902%)
I3              = 2022.43          +/- 21.53        (1.065%)
I4              = 859.63           +/- 23.09        (2.686%)


FIXED:   T0 = 496.748
FIXED:   T1 = 463.461
FIXED:   T2 = 560.314
FIXED:   T3 = 431.031
FIXED:   T4 = 395.907
FIXED:   E0 = 1.671
FIXED:   E1 = 1.671
FIXED:   E2 = 1.671
FIXED:   E3 = 1.671
FIXED:   E4 = 1.671
This file shows the standard errors on the intensity of the various peaks, as well as the results for the temperature, intensity and energy. Note that in the current version the energy (i.e. the width of the peaks) are kept at a fixed value. The value was chosen to match that of peak 5 in TLD-700.
If you need the value of the integral of the peaks along with the standard error, there is the script integrator_gsl.sh in the /INTEGRATOR directory which calculates this from the .gfit2 files. Invoke with integrator_gsl.sh "*.gfit2". This script uses a little program which needs the Gnu GSL library installed.
Download
All files are availble as a tarball here:- [DECONVOLUTION-2.0.tar.gz]
- [DECONVOLUTION-1.0.tar.gz] - old version.
References
[1] G. Kitis, J.M. Gomez-Ros and J.W.N. Tuyn, "Thermoluminescence glow-curve deconvolution functions for first, second and general order kinetics", J. Phys. D: Appl. Phys. 31, (1998) 2636-2641.29.06.2005 - Niels Bassler - http://www.phys.au.dk/~bassler